Tables
View live telemetry in tables.
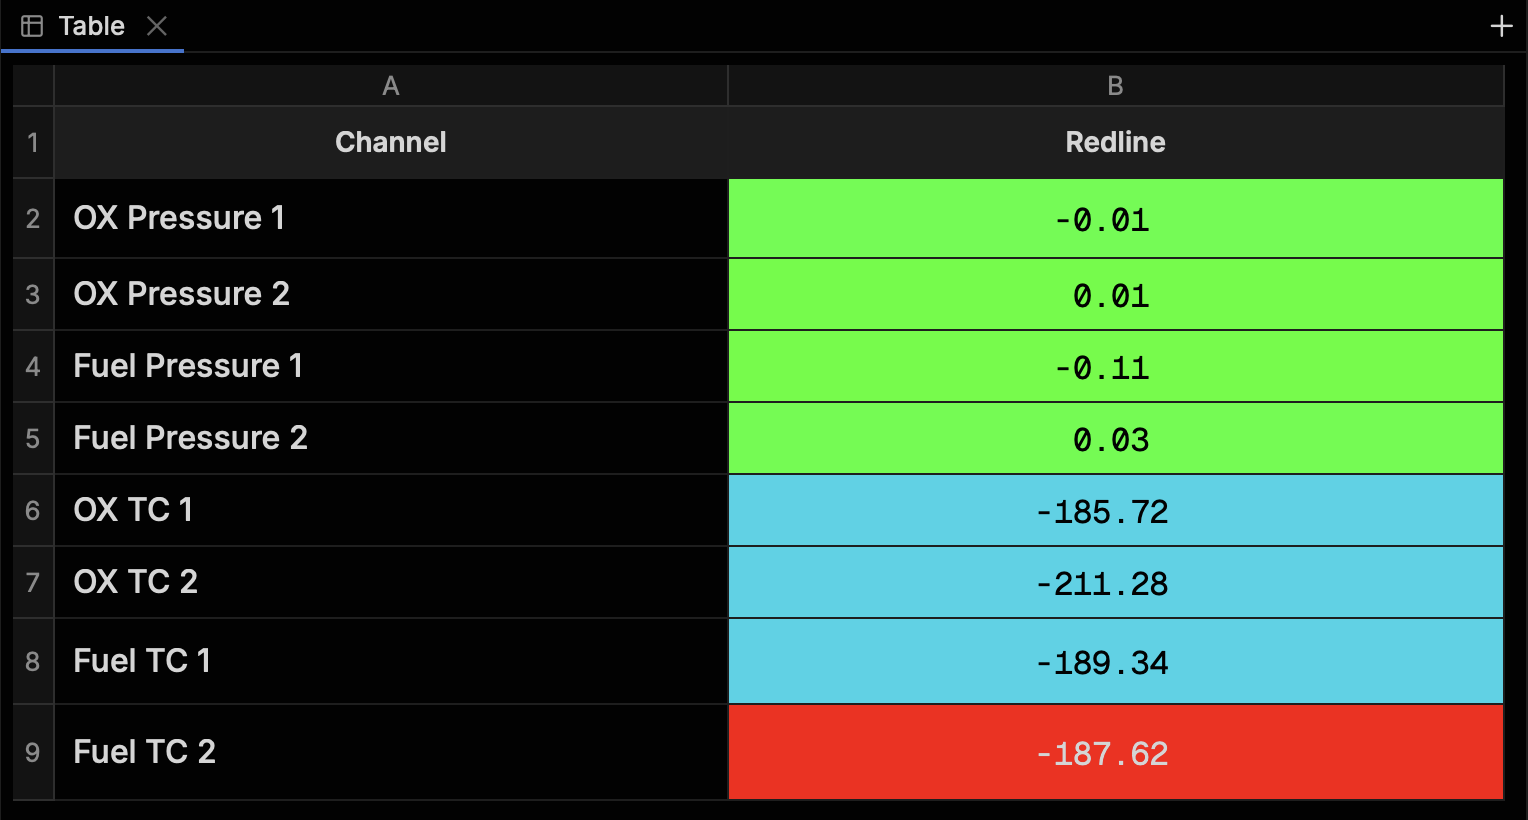
Tables display live telemetry in a tabular format. They are useful for dashboards, viewing many channels at once, and conditionally coloring values that exceed thresholds.
Creating a table
Create a table with the Create a table command in the command palette, or by adding a new tab and selecting the table visualization.
Make sure that you are working in an active project. A table created outside one is not saved.
Configuring the table
Click the table button in the bottom-left corner to open the Component Toolbar and configure the table.
Text cells
Text cells display a line of text. You can change the alignment, weight, and size.
Value cells
Value cells function like values on a schematic. They display live data and update as new data arrives.
Redlining a value
Redline a value to change its background color when it passes a threshold. In the cell’s
Redline tab, click Add band, then set the threshold and the color of the band.
Each band has a threshold and a color. A band paints the values at or above its
threshold and below the next higher threshold. Values below every threshold show the
fill from the Style tab. By default, the fill paints nothing.
- Transition ->
Stepschanges the color at each threshold.Smoothblends the colors between thresholds. - Flash (lightning icon) -> Makes the band blink between its color and the fill while the value is in the band.

Editing several cells
Select several cells to edit them at once. The Text and Fill controls show “Mixed” when the selected cells use different colors. The Selection control lists each color the cells use. Change a swatch to recolor every cell that uses that color. Staleness and number format settings show when the selection holds a value cell, and apply only to value cells.
Sharing and exporting
Select Copy link from the Projects or Component Toolbar. Anyone on the Core can open it from a browser.
Select Export to save the table as a JSON file. Drag the file back into the Console to import it.